Education Secretary Arne Duncan is sick and tired of all those states that "lie" to their students:
Angry Arne's construction here is something I've heard echoed over and over again throughout Reformyland: we must set higher standards for our children if they are ever going to succeed in the real world of 21st century global competition knowledge-based competitive blah blah blah...“The idea that the Common Core standards are nationally-imposed is a conspiracy theory in search of a conspiracy. The Common Core academic standards were both developed and adopted by the states, and they have widespread bipartisan support. GOP leaders like Jeb Bush and governors Mitch Daniels, Chris Christie, and Bill Haslam have supported the Common Core standards because they realize states must stop dummying down academic standards and lying about the performance of children and schools. In fact, South Carolina lowered the bar for proficiency in English and mathematics faster than any state in the country from 2005 to 2009, according to research by the National Center for Education Statistics.“That’s not good for children, parents, or teachers. I hope South Carolina lawmakers will heed the voices of teachers who supported South Carolina’s decision to stop lowering academic standards and set a higher bar for success. And I hope lawmakers will continue to support the state’s decision to raise standards, with the goal of making every child college- and career-ready in today’s knowledge economy.” [emphasis mine]
But is it true? Does setting higher standards lead to better performance?
Let's find out.
Every few years, the good folks at the National Center for Education Statistics put out a cool piece of research that attempts to shed light on how states judge their student to be "proficient." Earlier this month, NCES released "Mapping State Proficiency Standards Onto NAEP Scales: Results From the 2013 NAEP Reading and Mathematics Assessments." They even made a nice little video about the report:
There are some statistical tricks involved here, but the overall method is fairly simple. Let's say your state declared that 70 percent of its students were "proficient" in math when judged by their own state test. But only 60 percent of the kids in my state ranked as "proficient." It may sound like your state is doing better, but it's actually impossible to compare your state to my state: our kids took a different test, and we likely have a different definition of "proficient" than your state does.
How can we actually compare what you call proficient and what I call proficient? Luckily, kids in both states (not all of them, but a large enough sample that we can feel very confident about the results) took the same national achievement test: the National Assessment of Educational Progress, or NAEP, which assesses math and reading at Grade 4 and Grade 8.
Because we know the percentages of kids deemed "proficient" on each of our states' tests, we can look up that same percentage for both of our states on the NAEP. First, we look at the cut score for the 70th percentile of your kids on the NAEP; that is, the minimum score that would represent what 70 percent of your state's kids got on the national test. Then we'll do the same for my state's kids, but look at the 60th percentile. We can then compare the two NAEP scores and determine who has the higher bar for proficiency.
If your bar is higher... well, you're really kicking my state's butt. But if my bar is higher, I can point a finger at your state and say: "Aha! You're 'lying' to your kids, because you set your standards too low!"
When the NCES people released their study, they put out tables showing where these cut scores are for each state. And this led to the predictable wailing and gnashing of teeth that low expectations are holding our students back in states where proficiency standards are low.
But here's the thing: it's actually pretty easy to test this premise. If reformy types are correct and "high expectations" lead to better outcomes, the states with higher standards for proficiency should have higher NAEP scores.
So that's the hypothesis we'll test: do the states with higher proficiency rates actually do better on the NAEP? If they do, the reformy theory holds up, and we should set the bar higher for everyone. What would that look like?

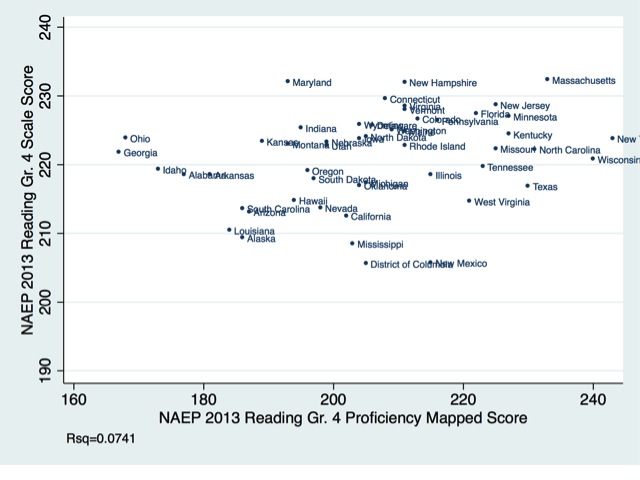
I know the scatterplots make some of you nuts, but bear with me -- this is actually pretty simple. If high proficiency standards lead to higher test scores, we're going to see something like the graph above, which is a strong correlation between the two variables. As your proficiency standard goes up, your test scores goes up. But if the two aren't related, we'll get something like this:

See how all the points are in a cloud? There's no correlation; standards for proficiency don't have a relationship to how states actually do on tests. Got it? OK, let's go to the data; click on the pics to expand them.
All students, Grade 4 Reading:
All students, Grade 8 Reading:

Do you see a strong correlation, or do you see a cloud of points?
Mathematically, a correlation just isn't there: that "Rsq" in the bottom left is a measure of how well the mapped proficiency standard scores (x-axis) can "explain" the actual test scores (y-axis). If Rsq is 0, there's not a correlation; if it's 1, the correlation is perfect. These rsq's are so low they are statistically insignificant (p < 0.05 for those of you who need to know).
Let me put it this way: West Virginia sets a higher bar for "proficient" than Ohio does on both Grade 4 and Grade 8 reading. You can see this because West Virginia is much further to the right than Ohio on the graph. But Ohio outperforms West Virginia in both tests; in fact, Ohio WAY outperforms on Grade 8 reading, because it is much higher up on the graph than West Virginia.
Yes, there are states that have high proficiency standards and high scores (Minnesota), but there are states with low proficiency standards and high scores (Idaho). There are states with low proficiency standards and low scores (Alabama); but there are states with high proficiency standards and low scores (Nevada). Proficiency standards in reading and actual achievement in reading are not related.
What about math? All students, Grade 4:

All students, Grade 8 Math:

So here we have a bit of a correlation, and it is statistically significant. But it's very weak: only 10 to 13 percent of the variation in test scores can be "explained" by the proficiency standard.
Why math and not reading? Two reasons: one for sure, one on which I'm simply conjecturing. First, most of the correlation comes from the lowest mapped proficiency scores. If you take those away, the correlation no longer exists. For Grade 4 math, for example, I'll remove the bottom 6 data points.


The correlations are no longer statistically significant.* But I think something else might be at play here.
I'm not a math educator, so I'm going to go out on a limb, but I've seen some evidence of this before: outcomes on math assessments are a little more dependent on aligning instruction with the assessment than language arts assessments. In other words, if you taught everything else well on a math test but you missed, say, calculating a circle's circumference, your students are going to get dinged hard if that's on the test. But if you taught them a different list of vocabulary words than those used on the test, they're less likely to get dinged. Those of you with expertise, please weigh in and tell me if I'm blowing smoke or not.
In any case, even if we think there is a correlation between the proficiency standards in math and math outcomes, that correlation is very weak. And, again, in reading, it's not there at all.
What does all this mean -- that proficiency standards don't matter? No, of course not. If we're going to have meaningful assessments, we have to set the bar somewhere; we may as well do it right and set reasonably high standards for what our students should be able to do.
My point is this: the empirical evidence suggests that state proficiency standards have, at best, a minor effect on student outcomes. Angry Arne and many others have focused in on what is, in reality, a minor concern when it comes to helping statewide education systems improve.
Regular readers have undoubtedly already figured out where I think the SecEd's time and attention would be better spent.
There's a question I haven't yet addressed: even if higher proficiency standards don't make a big difference for all students, do they help children in economic disadvantage, or who are in historically underserved racial groups?
Standby...

You mean there's more?
Here's Part II of this post.
* In a linear model with p < 0.05. Which is the point.
1 comment:
Thanks for bringing some clarity to the Honesty Gap
Post a Comment