I will protect your pensions. Nothing about your pension is going to change when I am governor. - Chris Christie, "An Open Letter to the Teachers of NJ" October, 2009

Sunday, September 23, 2018

Charter Schools Do Not Promote Diversity

Peter Greene had a useful post the other day about how to spot bad education research. One sure sign is cherry-picking: focusing on a few observations – or even just one – and then suggesting these few are representative of the whole. This tactic is a favorite among charter school cheerleaders, who will extoll X's high test scores and Y's high special education rates – without mentioning X's special education rates and Y's test scores.

Here's a recent example from New Jersey:

Earlier this month, the New Jersey Charter School Association (NJCSA) filed a motion to intervene in a lawsuit: Latino Action Network v. State of New Jersey. The lawsuit contends New Jersey has some of the most segregated public schools in the nation (it does), and proposes a series of remedies. One notable feature of the lawsuit is that it is critical of charter schools:
Because charter schools are thus required to give priority in enrollment to students who reside in their respective districts, and because they tend to be located predominantly in intensely segregated urban school districts, New Jersey’s charter schools exhibit a degree of intense racial and socioeconomic segregation comparable to or even worse than that of the most intensely segregated urban public schools. Indeed, 73% of the state’s 88 charter schools have less than 10% White students and 81.5% of charter school students attend schools characterized by extreme levels of segregation, mostly because almost all the students are Black and Latino. [emphasis mine]
As you can imagine, this didn't sit well with the NJCSA:
On Thursday, September 6, the New Jersey Charter Schools Association asked a state court judge for permission to intervene into the historic school desegregation case [Latino Action Network v. State of New Jersey] on behalf of its member schools. Charter schools are part of the desegregation solution—they are not the problem. In fact, an important tool to combat school segregation is empowering parents with meaningful public school choice. While we share the values and goals of diverse, high-performing schools that serve a broad range of students, we are intervening to address baseless attacks on charter schools and ensure that our students and families have a seat at the table. [emphasis mine]
Now that is a provocative claim: NJCSA is stating not just that New Jersey charters aren't making school segregation worse, they are actually contributing to the desegregation the state's schools. On what do they base this claim?

In the motion*, NJCSA references this data point to make their case:
Three of the most “diverse” schools in New Jersey are charter schools when measured by the probability that any two students selected at random will belong to the same ethnic group (Learning Community Charter School, The Ethical Community Charter School and Beloved Community Charter School). In the 2017-2018 school year, about 49,100 children in New Jersey were charter school students. A true and correct copy of NJCSA fact sheets are attached hereto as Exhibit B. [emphasis mine]
Attached to the motion is a document found here, published by NJCSA. Here's the relevant factoid:

I checked the claim and it is, indeed, factually correct. It's also a brazen example of cherry-picking.

I'll go through all the data below.., but even if I didn't, it should be obvious that this is an absurdly narrow way to judge the entire New Jersey charter sector. Yes, three charter schools in Jersey City are diverse by this measure -- but what about the others? How can we assess the entire sector based on three schools from one city?

NJCSA is apparently using a measure known as Simpson's Diversity Index to calculate school-level racial diversity. I'll leave aside a discussion of whether this is the best measure available or not, and instead note that the SDIs that I calculated, using data from the NJ Department of Education, showed that these three charter schools did, in fact, rank as numbers 2, 9, and 10 in the state. This means that it is more likely, relative to the other schools in New Jersey, that if you selected two students from these schools they would be of different races.

The obvious question, however, is whether these schools are typical of the entire NJ charter sector. There are several way to approach this; I'm going to present three.

First, let's look at all NJ charters, keeping in mind that they vary in the size of their enrollments. Let's rank all NJ schools by their SDI, then divide them into 10 "bins," weighting those bins by student enrollments. How would charter schools be distributed?


34 percent of New Jersey's charter students are in the least diverse schools by rank. The bottom diversity decile has, by far, the most charter students.

I am using rank here because NJCSA used it; however, there are (at least) two problems with this analysis. First, using rank can spread out measures that are clustered, making the distribution look more "flat" than it really is. Second, we can't see how charters compare with public district schools in diversity.

So here's a histogram that shows compares how charter students and public district students are distributed into schools of differing diversities:


This takes a little explaining, so hang with me. The SDI in New Jersey varies from 0 (the least diverse school) to .76 (the most diverse school). I've divided all the students in New Jersey into 10 bins again; then I marked whether they were in charter or public schools. The green bars represent students in public district schools; the clear bars are the charter students.

The bar on the far left represents the least diverse schools. About 1 percent of the students in public district schools are in the least diverse schools. But 11 percent of charter students are in the least diverse schools by SDI. You can clearly see similar disparities for the next two bars.

This switches around at the other end of the graph, where the most diverse schools are. A greater proportion of public district school students are in the most diverse schools; a greater proportion of charter school students are in the least diverse schools.

The graph above is admittedly tough to wrap your head around. Let's make it simple: we'll divide all students into those who attend schools that are above average in diversity, and those who attend schools that are below average in diversity. How does that play out?


On average, New Jersey's charter school students attend schools that are less diverse than public, district school students.

Look, I'll be the first to say the using Simpson's Diversity Index as a measure of school diversity has its limitations. But NJCSA chose the metric – and then they cherry-picked their results.

If you want a seat at the table when it comes to addressing the serious problems New Jersey has with school segregation, you should be prepared to contribute positively and meaningfully. Stuff like this doesn't help.


* I was sent the motion by one of the parties involved. Can't find a copy on the internet, though, including the NJCSA website. If someone can direct me to a link, I'll add it.

Tuesday, September 4, 2018

An Open Letter to NJ Sen. Ruiz, re: Teacher Evaluation and Test Scores

Tuesday, September 4, 2018

The Honorable M. Teresa Ruiz
The New Jersey Senate
Trenton, NJ

Dear Senator Ruiz,

As thousands of New Jersey teachers are heading back to school this week, this is an excellent time to address your recent comments about changes Governor Murphy's administration has made to state rules regarding the use of test scores in teacher evaluations.

As you know, the Murphy administration has announced that test score growth, as measured in median Student Growth Percentiles (mSGPs), will now count for 5 percent of a relevant teacher's evaluation, down from 30 percent during the Christie administration.

Here is your complete statement on Facebook:
State Sen. President Steve Sweeney and I are deeply disappointed that the administration is walking away from New Jersey's students by reducing the PARCC assessment to count for only five percent of a teacher’s evaluation. These tests are about education, not politics. We know teacher quality is the most impactful in-school factor affecting student achievement. That is why we were clear when developing TEACHNJ and working with all education stakeholders that student growth would have a meaningful place within evaluations. Reducing the use of Student Growth Percentile to five percent essentially eliminates its impact. It abandons the mission of TEACHNJ without replacing it with a substantive alternative. In fact, a 2018, a Rand study concluded that, ‘Teaching is a complex activity that should be measured with multiple methods.’ These include: student test scores, classroom observation, surveys and other methods. This is the second announcement in a series concerning the lowering of standards for our education professionals and students. We look forward to the department providing data as to why these decisions are being made and how they will benefit our children. Every child deserves a teacher who advances their academic progress and prepares them for college and career readiness. We must provide the data and resources for all our teachers to excel and ensure every student has the opportunity to realize their fullest potential. No one should see this move as a ‘Win.’ This is a victory for special interests and a huge step backward towards a better public education in New Jersey.”
Senator, as both a teacher and an education researcher, I share your commitment to providing New Jersey's children with the best possible public education system. I certainly agree that teachers are important, although, as Dr. Matt DiCarlo of the Shanker Institute has noted, the claim that teacher quality is the most important in-school factor affecting student outcomes is highly problematic.

I'll leave aside a discussion of this for now, however, to focus instead on the idea that reducing the weight of SGPs in a teacher's evaluation is somehow "a huge step backwards." To the contrary: when we consider the evidence, it is clear that the way New Jersey has been using SGPs in teacher evaluations until now has been wholly inappropriate. Governor Murphy's policy, therefore, can only be described as an improvement.

Allow me to articulate why:

- SGPs are descriptive measures of student growth; they do not show how teachers, principals, schools, or many other factors influence that growth. If anyone doubts this, they need only read the words of Dr. Damian Betebenner, the creator of SGPs:
Borrowing concepts from pediatrics used to describe infant/child weight and height, this paper introduces student growth percentiles (Betebenner, 2008). These individual reference percentiles sidestep many of the thorny questions of causal attribution and instead provide descriptions of student growth that have the ability to inform discussions about assessment outcomes and their relation to education quality.(1)
- You can't hold a teacher accountable for things she can't control. Senator, in your statement, you imply that student growth should be a part of a teacher's evaluation. But a teacher's effectiveness is obviously not the only factor that contributes to student outcomes. As the American Statistical Association states: "...teachers account for about 1% to 14% of the variability in test scores, and that the majority of opportunities for quality improvement are found in the system-level conditions."(2)

Simply put: a teacher's effectiveness is a part, but only a part, of a child's learning outcomes. We should not attribute all of the changes in a student's test scores from year-to-year solely to a teacher they had from September to May; too many other factors influence that student's "growth."

- SGPs do not fully control for differences in student characteristics. In 2013, then Education Commissioner Chris Cerf claimed that an SGP "... fully takes into account socio-economic status." (3) Repeated analyses (4), however, show he was incorrect; SGPs do, in fact, penalize teachers and schools who teach more students who qualify for free lunch, a marker of socio-economic disadvantage.

For example:


This scatterplot shows a clear and statistically significant downward trend in schoolwide math SGPs as the percentage of free lunch-eligible students grows. A school where all of the students are eligible for free lunch will have, on average, a math SGP 14 points lower than a school where no students qualify for free lunch.

I have many more examples of this bias, using recent state data, here.

- The bias in SGPs is due to a statistical property acknowledged by its inventor; there is no evidence it is due to schools or teachers serving disadvantaged children being less effective. In a paper by Betebenner and his colleagues (5), the authors acknowledge SGPs have statistical properties that cause them to be biased against students (and, therefore, their teachers) with lower initial test scores. The authors propose a solution, but acknowledge it cannot fully correct for all the biases inherent in SGPs.

Further: there has been, to my knowledge, no indication that NJDOE is aware of this bias or has taken any steps to correct it. To be blunt: New Jersey should not be forcing districts to make decisions based on SGPs when they have inherent statistical properties that make them biased – especially when there is no indication that the state has ever understood what those properties are.

- SGPs are calculated through a highly complex process; it is impossible for any layperson to understand how their SGP was determined. SGPs are derived from a quantile regression model, a complicated statistical method. As researchers at the University of Massachusetts, Amherst (6) note:
Clauser et al. (2016) surveyed over 300 principals in Massachusetts to discover how they used SGPs and to test their interpretations of SGP results. They found over 80% of the principals used SGPs for evaluating the school, over 70% used SGPs to identify students in need of remediation, and almost 60% used SGPs to identify students who achieved exceptional gains. These results suggest SGPs are being used for important purposes, even though they are full of error. The study also found that 70% of the principals misinterpreted what an average SGP referred to, and 70% incorrectly identified students for remediation based on low SGPs, when they actually performed very well on the most recent year’s test. Extrapolating from this Massachusetts study, it is likely SGPs are leading to incorrect decisions and actions in schools across the nation. (emphasis mine)
It is worth noting the authors could not find any empirical studies to support the use of SGPs in teacher evaluation.


Senator, in my opinion, one of the problems with TEACHNJ is that it mandates that school districts make high-stakes personnel decisions on the basis of SGPs, which are biased, prone to error, and unvalidated as teacher evaluation tools. SGPs could, in fact, be useful for teacher evaluation if they informed decisions, rather than forced them.

Principals might use the information from SGPs to select teachers for heightened scrutiny when conducting observations. Superintendents might use school-level SGPs to check whether their district's schools vary in their growth outcomes. The state might use SGPs as a marker to determine whether a school district's effectiveness needs to be looked at more carefully.

But when the state forces a district to make a high-stakes decision by substantially weighting SGPs in a teacher's evaluation, the state is also forcing that district to ignore the many complexities inherent in using SGPs. For that reason, minimizing the weight of SGPs was, in fact, a "win" for New Jersey public schools, and for the state's students.

As always, Senator, I am happy to discuss these and any other issues regarding teacher evaluation with you at any time.

Sincerely,

Mark Weber
New Jersey Public School Teacher
Doctoral Candidate in Education Policy, Rutgers University


References:

1) Betebenner, D. (2009). Norm- and Criterion-Referenced Student Growth. Educational Measurement: Issues and Practice, 28(4), 42–51. https://doi.org/10.1111/j.1745-3992.2009.00161.x (emphasis is mine)

2) American Statistical Association. (2014). ASA Statement on Using Value-Added Models for Educational Assessment. Retrieved from http://www.amstat.org/asa/files/pdfs/POL-ASAVAM-Statement.pdf

3) https://www.wnyc.org/story/276664-everything-you-need-know-about-students-baked-their-test-scores-new-jersy-education-officials-say/

4) See:

- Baker, B.D. & Oluwole, J (2013) Deconstructing Disinformation on Student Growth Percentiles & Teacher Evaluation in New Jersey. Retrieved from:
https://njedpolicy.wordpress.com/2013/05/02/deconstructing-disinformation-on-student-growth-percentiles-teacher-evaluation-in-new-jersey/

- Baker, B.D. (2014) An Update on New Jersey’s SGPs: Year 2 – Still not valid! Retrieved from: https://schoolfinance101.wordpress.com/2014/01/31/an-update-on-new-jerseys-sgps-year-2-still-not-valid/

- Weber, M.A. (2018) SGPs: Still Biased, Still Inappropriate To Use For Teacher Evaluation. Retrieved from: http://jerseyjazzman.blogspot.com/2018/07/sgps-still-biased-still-inappropriate.html

5) Shang, Y., VanIwaarden, A., & Betebenner, D. W. (2015). Covariate Measurement Error Correction for Student Growth Percentiles Using the SIMEX Method. Educational Measurement: Issues and Practice, 34(1), 4–14. https://doi.org/10.1111/emip.12058

6) Sireci, S. G., Wells, C. S., & Keller, L. A. (2016). Why We Should Abandon Student Growth Percentiles (Research Brief No. 16–1). Center for Educational Assessment, University of Massachusetts. Amherst. Retrieved from https://www.umass.edu/remp/pdf/CEAResearchBrief-16-1_WhyWeShouldAbandonSGPs.pdf

Sunday, July 22, 2018

SGPs: Still Biased, Still Inappropriate To Use For Teacher Evaluation

Let's suppose you and I get jobs digging holes. Let's suppose we get to keep our jobs based on how well we dig relative to each other.

It should be simple to determine who digs more: all our boss has to do is measure how far down our holes go. It turns out I'm much better at digging than you are: my holes are deeper, I dig more of them, and you can't keep up.

The boss, after threatening you with dismissal, sends you over to my job site so you can get professional development on hole digging. That's where you learn that, while you've been using a hand shovel, I've been using a 10-ton backhoe. And while you've been digging into bedrock, I've been digging into soft clay.

You go back to the boss and complain about two things: first, it's wrong for you and me to be compared when the circumstances of our jobs are so different. Second, why is the boss wasting your time having me train you when there's nothing I can teach you about how to do your job?

The boss has an answer: he is using a statistical method that "fully takes into account" the differences in our jobs. He claims there's no bias against you because you're using a shovel and digging into rock. But you point out that your fellow shovelers consistently get lower ratings than the workers like me manning backhoes.

The boss argues back that this just proves the shovelers are worse workers than the backhoe operators. Which is why you need to "learn" from me, because "all workers can dig holes."

Everyone see where I'm going with this?

* * *

There is a debate right now in New Jersey about how Student Growth Percentiles (SGPs) are going to be used in teacher evaluations. I've written about SGPs here many times (one of my latest is here), so I'll keep this recap brief:

An SGP is a way to measure the "growth" in a student's test scores from one year to the next, relative to similar students. While the actual calculation of an SGP is complicated, here's the basic idea behind it:

A student's prior test scores will predict their future performance: if a student got low test scores in Grades 3 through 5, he will probably get a low score in Grade 6. If we gather together all the students with similar test score histories and compare their scores on the latest test, we'll see that those scores vary: a few will do significantly better than the group, a few will do worse, and most will be clustered together in the middle.

We can rank and order these students' scores and assign them a place within the distribution; this is, essentially, an SGP. But we can go a step further: we can compare the SGPs from one group of students with the SGPs from another. In other words: a student with an SGP of 50 (SGPs go from 1 to 99) might be in the middle of a group of previously high-scoring students, or she might be in the middle of a group of previously low scoring students. Simply looking at her SGP will not tell us which group she was placed into.

To make an analogy to my little story above: you and I might each have an SGP of 50. But there's no way to tell, solely based on that, whether we are digging into clay or bedrock. And there's no way to tell from a students' SGP whether they score high, low, or in the middle on standardized tests.

And this is where we run into some very serious problems:

The father of SGPs is Damian Betebenner, a widely-respected psychometrician. Betebenner has written several papers on SGPs; they are highly technical and well beyond the understanding of practicing teachers or education policymakers (not being a psychometrician, I'll admit I have had to work hard to gain an understanding of the issues involved).

Let's start by first acknowledging (and as Bruce Baker pointed out years ago) that Betebenner himself believes that SGPs do not measure a teacher's contribution to a student's test score growth. SGPs, according to Betebenner, are descriptive; they do not provide the information needed to say why a student's scores are lower or higher than prediction:
Borrowing concepts from pediatrics used to describe infant/child weight and height, this paper introduces student growth percentiles (Betebenner, 2008). These individual reference percentiles sidestep many of the thorny questions of causal attribution and instead provide descriptions of student growth that have the ability to inform discussions about assessment outcomes and their relation to education quality. A purpose in doing so is to provide an alternative to punitive accountability systems geared toward assigning blame for success/failure (i.e., establishing the cause) toward descriptive (Linn, 2008) or regulatory (Edley, 2006) approaches to accountability.(Betebenner, 2009) [emphasis mine]
This statement alone is reason enough why New Jersey should not compel employment decisions on the basis of SGPs: You can't fire a teacher for cause on the basis of a measure its inventor says does not show cause.

It's also important to note that SGPs are relative measures. "Growth" as measured by an SGP is not an absolute measure; it's measured in relationship to other, similar students. All students could be "growing," but an SGP, by definition, will always show some students growing below average.

But let's put all this aside and dig a little deeper into one particular matter:

One of the issues Betebenner admits is a problem with using SGPs in teacher evaluation is a highly technical issue known as measurement endogeneity; he outlines this problem in a paper he coauthored in 2015(2) -- well after New Jersey adopted SGPs as its official "growth" measure.

The problem occurs because test scores are error-prone measures. This is just another way of saying something we all know: test scores change based on things other than what we want to measure.

If a kid gets a lower test score than he is capable of because he didn't have a good night's sleep, or because he's hungry, or because the room is too cold, or because he gets nervous when he's tested, or because some of the test items were written using jargon he doesn't understand, his score is not going to be an accurate representation of his actual ability.

It's a well-known statistical precept that variables measured with error tend to bias positive estimates in a regression model downward, thanks to something called attenuation bias. (3) Plain English translation: Because test scores are prone to error, the SGPs of higher-scoring students tend to be higher, and the SGPs of lower-scoring students tend to be lower.

Again: I'm not saying this; Betebenner -- the guy who invented SGPs -- and his coauthors are:
It follows that the SGPs derived from linear QR will also be biased, and the bias is positively correlated with students’ prior achievement, which raises serious fairness concerns.... 
The positive correlation between SGP error and latent prior score means that students with higher X [prior score] tend to have an overestimated SGP, while those with lower X [prior score] tend to have an underestimated SGP. (Shang et al., 2015)
Again, this means we've got a problem at the student level with SGPs: they tend to be larger than they should be for high-scoring students, and lower than they should be for low-scoring students. Let me also point out that Betebenner and his colleagues are the ones who, unprompted, bring up the issue of "fairness."

Let's show how this plays out with New Jersey data. I don't have student-level SGPs, but I do have school-level ones, which should be fine for our purposes. If SGPs are biased, we would expect to see high-scoring schools show higher "growth," and low-scoring schools show lower "growth." Is that the case?


New Jersey school-level SGPs are biased exactly the way its inventor predicts they would be -- "which raises serious fairness concerns."

I can't overemphasize how important this is. New Jersey's "growth" measures are biased against lower-scoring students, not because their "growth" is low, but likely because of inherent statistical properties of SGPs that make them biased. Which means they are almost certainly going to be biased against the teachers and schools that enroll lower-scoring students.

Shang et al. propose a way to deal with some of this bias; it's highly complex and there are tradeoffs. But we don't know if this method has been applied to New Jersey SGPs in this or any other year (I've looked around the NJDOE website for any indication of this, but have come up empty).

In addition: according to Betebenner himself, there's another problem when we look at the SGPs for a group of students in a classroom and attribute it to a teacher.

You see, New Jersey and other states have proposed using SGPs as a way to evaluate teachers. In its latest federal waiver application, New Jersey stated it would use median SGPs (mSGPs) as a way to assess teacher effectiveness. This means the state looks at all the scores in a classroom, picks the score of the student who is right in the middle of the distribution of those scores, and attributes it to the teacher.

The problem is that students and teachers are NOT randomly assigned to classrooms or schools. So a teacher might pay a price for teaching students with a history of getting lower test scores. Betebenner et al. freely admit that their proposed correction -- and again, we don't even know if it's currently being implemented -- can't entirely get rid of this bias.

As we all know, there is a clear correlation between test scores and student economic status. Which brings us to our ultimate problem with SGPs: Are teachers who teach more students in poverty unfairly penalized when SGPs are used to evaluate educator effectiveness?

I don't have the individual teacher data to answer this question. I do, however, have school-level data, which is more than adequate to at least address the question initially. What we want to know is whether SGPs are correlated with student characteristics. If they are, there is plenty of reason to believe these measures are biased and, therefore, unfair.

So let's look at last year's school-level SGPs and see how they compare to the percentage of free lunch-eligible students in the school, a proxy measure for student economic disadvantage. The technique I'm using, by the way, follows Bruce Baker's work year after year, so it's not like anything I show below is going to be a surprise.


SGPs in math are on the vertical or y-axis; percentage free lunch (FL%) is on the horizontal or x-axis. There is obviously a lot of variation, but the general trend is that as FL% rises, SGPs drop. On average, a school that has no free lunch students will have a math SGP almost 14 points higher than a school where all students qualify for free lunch. The correlation is highly statistically significant as shown in the p-value for the regression estimate.

Again: we know that, because of measurement error, SGPs are biased against low-scoring students/schools. We know that students in schools with higher levels of economic disadvantage tend have lower scores. We don't know if any attempt has been made to correct for this bias in New Jersey's SGPs.

But we do know that even if that correction was made, the inventor of SGPs says: "We notice the fact that covariate ME correction, specifically in the form of SIMEX, can usually mitigate, but will almost never eliminate aggregate endogeneity entirely." (Shang et al., p.7)

There is more than enough evidence to suggest that SGPs are biased and, therefore, unfair to teachers who educate students who are disadvantaged. Below, I've got some more graphs that show biases based on English language arts (ELA) SGPs, and correlations with other student population characteristics.

I don't see how anyone who cares about education in New Jersey -- or any other state using SGPs -- can allow this state of affairs to continue. Despite the assurances of previous NJDOE officials, there is more than enough reason for all stakeholders to doubt the validity of SGPs as measures of teacher effectiveness.

The best thing the Murphy administration and the Legislature could do right now is to tightly cap the weighting of SGPs in teacher evaluations. This issue must be studied further; we can't force school districts to make personnel decisions on the basis of measures that raise "...serious fairness concerns..."

Minimizing the use of SGPs is the only appropriate action the state can take at this time. I can only hope the Legislature, the State BOE, and the Murphy administration listen.


Years ago, a snarky teacher-blogger warned New Jersey that test-based teacher evaluation was a disaster waiting to happen.


SCATERPLOTS:

Here's the correlation between ELA-SGPs and FL%. A school with all FL students will, on average, see a drop of more than 9 points on its SGP compared to a school with no FL students.


Here are correlations between SGPs and the percentage of Limited English Proficient (LEP) students.  I took out a handful of influential outliers that were likely the result of data error. The ELA SGP bias is not statistically significant; the math SGP bias is.


There are also positive correlations between SGPs and the percentage of white students.


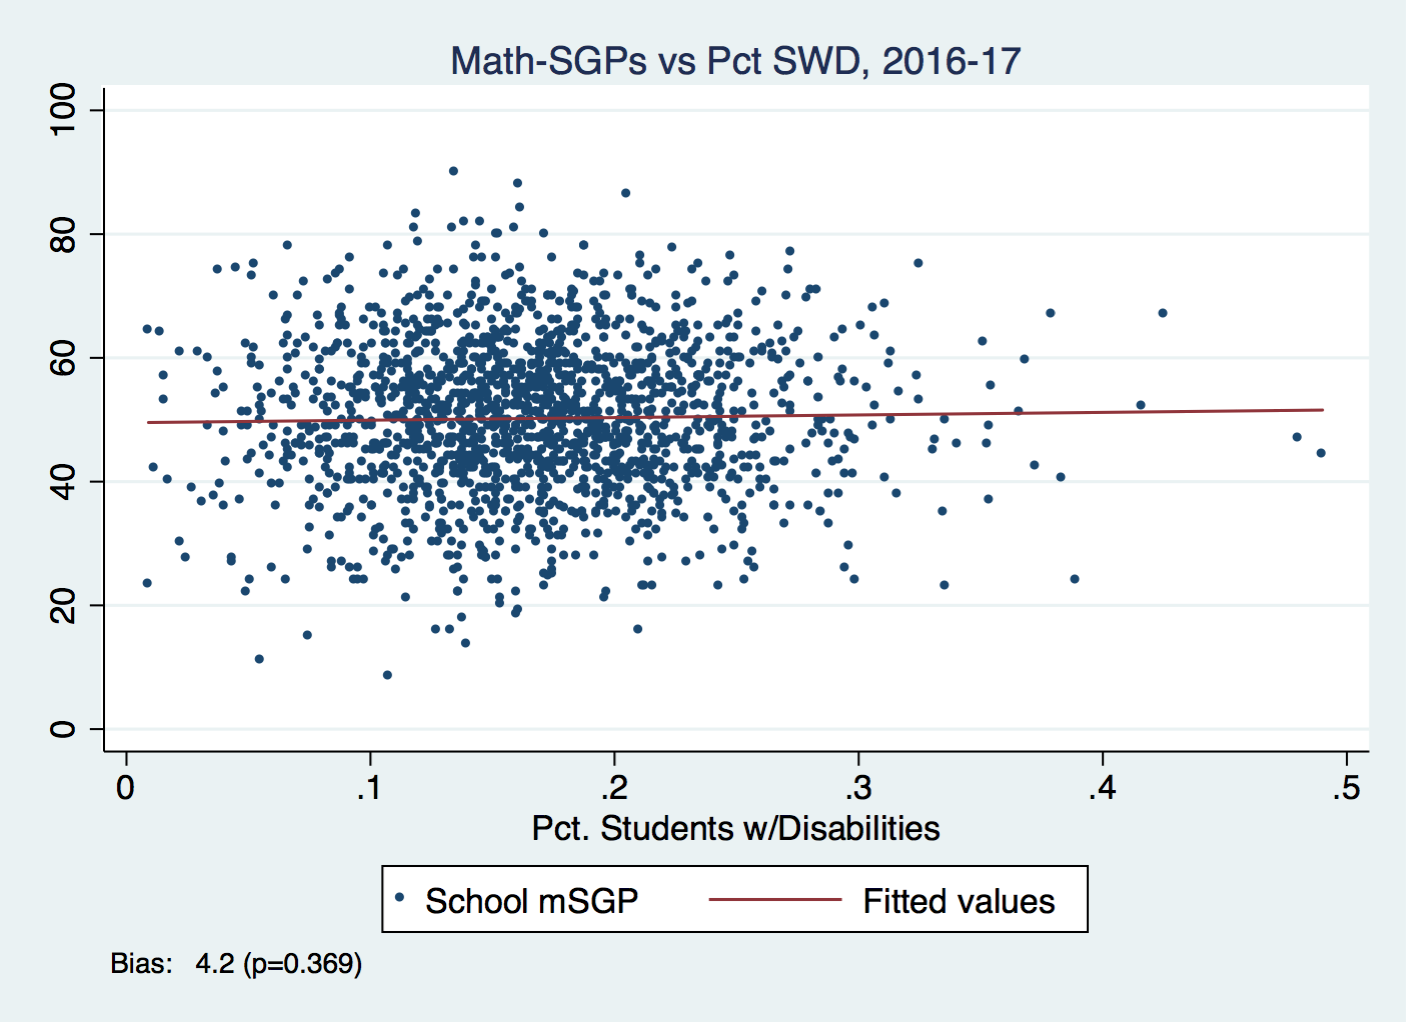
Here are correlations between students with disabilities (SWD) percentage and SGPs. Neither is statistically significant at the traditional level.


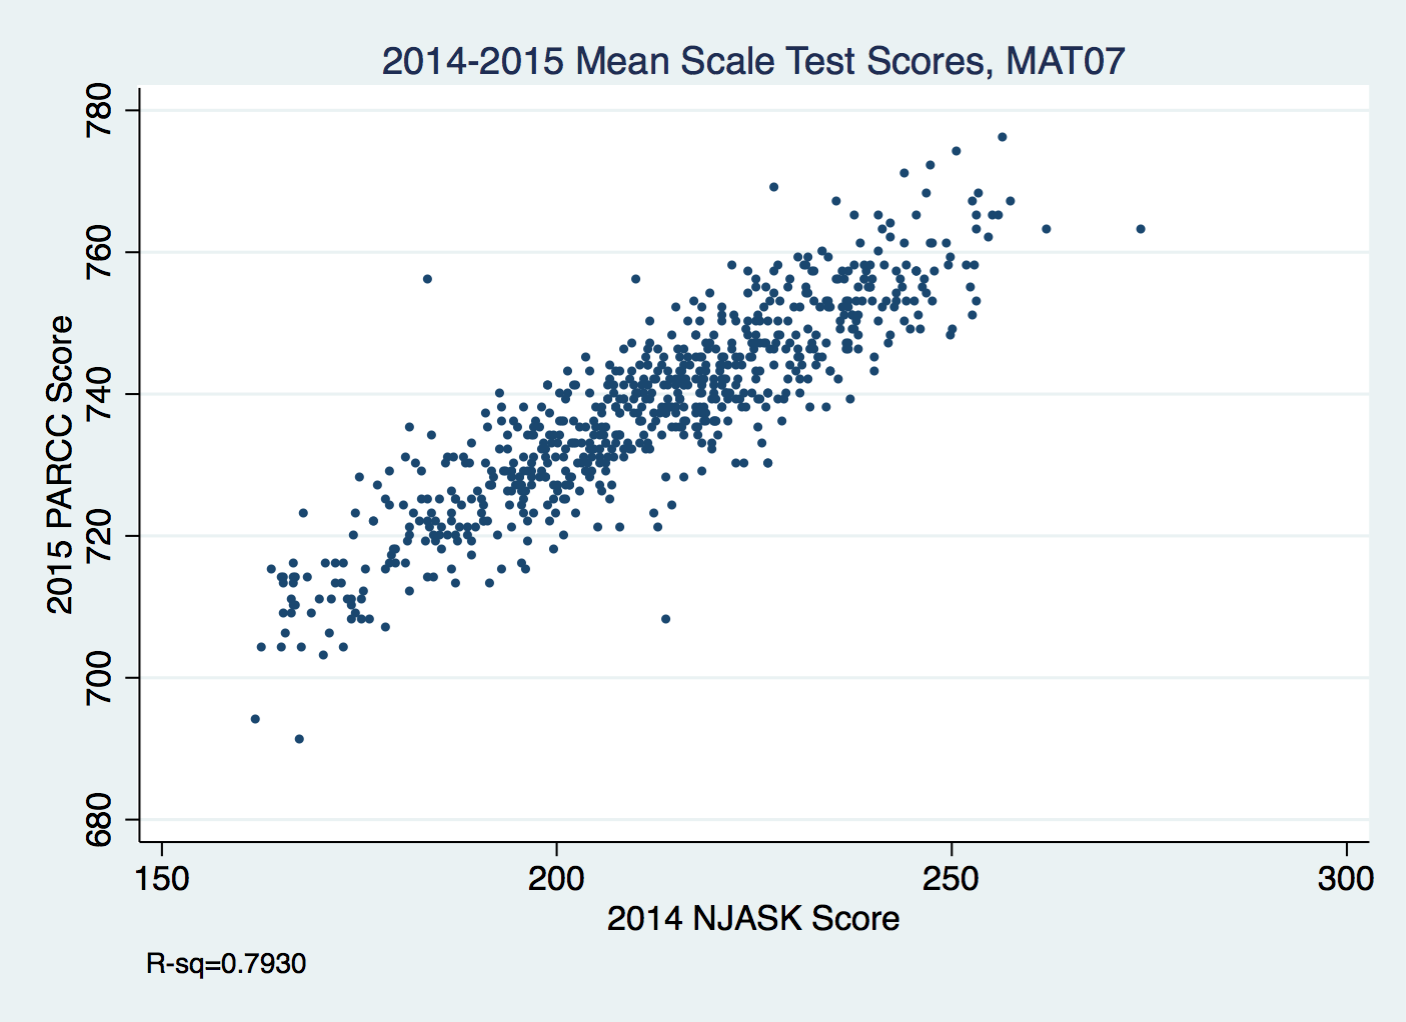
Finally, here are the correlations between some grade-level SGPs and grade-level test scores. I already showed Grade 5 math above; here's Grade 5 ELA.


And correlations for Grade 7.


Sources:

1) Betebenner, D. (2009). Norm- and Criterion-Referenced Student Growth. Educational Measurement: Issues and Practice, 28(4), 42–51. https://doi.org/10.1111/j.1745-3992.2009.00161.x

2) Shang, Y., VanIwaarden, A., & Betebenner, D. W. (2015). Covariate Measurement Error Correction for Student Growth Percentiles Using the SIMEX Method. Educational Measurement: Issues and Practice, 34(1), 4–14. https://doi.org/10.1111/emip.12058

3) Wooldridge, J. (2010). Econometric Analysis of Cross Section and Panel Data (Second Edition). Cambridge, MA: The MIT Press. p. 81.

Monday, July 16, 2018

The PARCC, Phil Murphy, and Some Common Sense

Miss me?

I'll tell you what I've been up to soon, I promise. I'm actually still in the middle of it... but I've been reading and hearing a lot of stuff about education policy lately, and I've decided I can't just sit back -- even if my time is really at a premium these days -- and let some of it pass.

For example:
Gov. Phil Murphy just announced that he will start phasing out the PARCC test, our state's most powerful diagnostic tool for student achievement.

Like an MRI scan, it can detect hidden problems, pinpointing a child's weaknesses, and identifying where a particular teacher's strategy isn't working. This made it both invaluable, and a political lighting rod.
That's from our old friends at the Star-Ledger op-ed page. And, of course, the NY Post never misses a chance to take down both a Democrat and the teachers unions:
New Jersey Gov. Phil Murphy is already making good on his promises to the teachers unions. Too bad it’s at the kids’ expense.
[...]
Officially, he wants the state to transition to a new testing system — one that’s less “high stakes and high stress.” It’s a safe bet that the future won’t hold anything like the PARCC exams, which are written by a multi-state consortium. Instead, they’ll be Jersey-only tests — far easier to water down into meaninglessness.


The sickest thing about this: A couple of years down the line, Murphy will be boasting about improved high-school graduation rates — without mentioning the fact that his “reforms” have made many of those diplomas worthless.
First of all -- and as I have pointed out in great detail -- it's the Chris Christie-appointed former superintendents of Camden and Newark, two districts under state control, who have done the most bragging about improved graduation rates. These "improvements" have taken place under PARCC; however, it's likely they are being driven by things like credit recovery programs, which have nothing to do with high school testing.

The Post wants us to believe that the worth of a high school diploma is somehow enhanced by implementing high school testing above and beyond what is required by federal law. But there's no evidence that's true.

In 2016-17, only 12 states required students to pass a test to graduate; the only other state requiring passing the PARCC is New Mexico. Further, as Stan Karp at ELC has pointed out, the PARCC passing rate on the Grade 10 English Language Test in 2017 was 46%; the passing rate on the Algebra I exam was 42%. That's three years after the test was first introduced into New Jersey.

Does the Post really want to withhold diplomas from more than half of New Jersey's students?

The PARCC was never designed to be a graduation exit exam. The proficiency rates -- which I'll talk about more below -- were explicitly set up to measure college readiness. It's no surprise that around 40 percent of students cleared the proficiency bar for the PARCC, and around 40 percent of adults in New Jersey have a bachelors degree.

I don't know when we decided everyone should go to a four-year college. If we really believe that, we'll have a lot of over-educated people doing necessary work, and we'll have to more than double the number of college seats available. Anyone think that's a good idea? NY Post, should New Jersey jack up taxes by an insane amount to open up its state colleges to more than twice as many students as they have now?

Let's move on to the S-L's editorial. The idea that the PARCC is somehow the "most powerful diagnostic tool" for identifying an individual child's weaknesses, and therefore the flaws in an individual teacher's practice, is simply wrong. The most obvious reason why the PARCC is not used for diagnosing individual students' learning progress is that by the time the school gets the score back, the student has already moved on to the next grade and another teacher.

There are, in fact, many other assessment tools available to teachers -- including plenty of tests that are not designed by the student's teacher -- that can give actionable feedback on a student's learning progress. This is the day-to-day business of teaching, taught to those of us in the field at the very beginning of our training: set objectives, instruct, assess, adjust objectives and/or instruction, assess, etc.

The PARCC, like any statewide test, might have some information useful to school staff as a child moves from grade-to-grade. But the notion that it is "invaluable" for its MRI-like qualities is just not accurate. How do I know?

Because the very officials at NJDOE during the Christie administration who pushed the PARCC so hard admitted it was not designed to inform instruction:


ERLICHSON: In terms of testing the full breadth and depth of the standards in every grade level, yes, these are going to be tests that in fact are reliable and valid at multiple cluster scores, which is not true today in our NJASK. But there’s absolutely a… the word "diagnostic" here is also very important. As Jean sort of spoke to earlier: these are not intended to be the kind of through-course — what we’re talking about here, the PARCC end-of-year/end-of-course assessments — are not intended to be sort of the through-course diagnostic form of assessments, the benchmark assessments, that most of us are used to, that would diagnose and be able to inform instruction in the middle of the year.
These are in fact summative test scores that have a different purpose than the one that we’re talking about here in terms of diagnosis.
That purpose is accountability. That's something I, and every other professional educator I know, is all for -- provided the tests are used correctly.

As I've written before, I am generally agnostic about the PARCC. From what I saw, the NJASK didn't seem to be a particularly great test... but I'll be the first to admit I am not a test designer, nor a content specialist in math or English language arts.

The sample questions I've seen from the PARCC look to me to be subject to something called construct-irrelevant variance, a fancy way of saying test scores can vary based on stuff you're trying not to measure. If a kid can't answer a math question because the question uses vocabulary the kid doesn't know, that question isn't a good assessor of the kid's mathematical ability; the scores on that item are going to vary based on something other than the things we really want to measure.

As I said, I'm not the best authority on the alleged merits of the PARCC over the NJASK (ask folks like this guy instead, who really knows what he's talking about when it comes to teaching kids how to read). I only wish the writers at the Star-Ledger had a similar understanding of their own limitations:
If this were truly for the sake of over-tested students, we wouldn't be starting with the PARCC. Unlike its predecessors, this test can tell educators exactly where kids struggle and how to better tailor their lessons. It's crucial for helping to close the achievement gap between black and white students; not just between cities and suburbs, but within racially mixed districts.
Again: the PARCC is a lousy tool for informing instruction, because that's not its job. The PARCC is an accountability measure -- and as such, there is very little reason to believe it is markedly better at identifying schools or teachers in need of remediation than any other standardized test.

Think about it this way: if the PARCC was really that much better than the NJASK, we'd expect the two tests to yield very different results. A school that was "lying" to its parents about its scores on the NJASK would instead show how it was struggling on the PARCC. There would be little correlation between the two tests if one was so much better than the other, right?

Guess what?


These are the Grade 7 English Language Arts (ELA) test scores on the 2014 NJASK and 2015 PARCC, the year it was first used in New Jersey. Each dot is a school around the state. Look at the strong relationship: if a school has a low score on the NJASK in 2014, it had a low score on the PARCC in 2015. Similarly, if it was high in 2014 on the NJASK, it was high on the 2015 PARCC. 80 percent of the variation on the PARCC can be explained by last year's score on the NJASK; that is a very strong relationship.

I'll put some more of these below, but let me point out one more thing: the students who took the Grade 7 NJASK in 2014 were not the same students who took the Grade 7 PARCC in 2015, because most students moved up a grade. How did the test scores of the same cohort compare when they moved from Grade 7, when they took the NJASK, to Grade 8, when they took the PARCC?


Still an extremely strong relationship.

No one who knows anything about testing is going to be surprised by this. Standardized tests, by design, yield normal, bell-curve distributions of scores: a few kids score low, a few score high, and most score in the middle. There's just no evidence to think the NJASK was "lying" back then any more than the PARCC "lies" now.

And let me anticipate the argument about "proficiency":


Again, I've been over this more than a few times: "proficiency" rates are largely arbitrary. When you have a normal distribution of scores, you can set the rate pretty much wherever you want, depending on how you define "proficient." I know that makes some of you crazy, but it's true: there is no absolute definition of "proficient," any more than there's an absolute definition of "smart."

So, no, the NJASK wasn't "lying" about NJ students' proficiency; the state could have used the same distribution of scores from the older test* and set a different proficiency level. And no, the PARCC is not in any way important as a diagnostic tool, nor is there any evidence it is a much "better" test than the old NJASK.

Look, I know this bothers some of you, but I am for accountability testing. The S-L is correct in noting that these tests have played an important role in pointing out inequities within the education system. I am part of a team that works on these issues, and we've relied on standardized tests to show that there are serious problems with our nation's current school funding system.

But if that's the true purpose of these tests -- and it's clear that it is -- then we don't need to spend as much time or money on testing as we do now. If we choose to use test outcomes appropriately, we can cut back on testing and remove some of the corrupting pressures they can impose on the system.


ADDING: This is not the first time I've written about the PARCC fetishism.

ADDING MORE: Does it strike any of you as odd that both the NY Post and the Star-Ledger came out with similar editorials beating up Governor Murphy and the teachers unions over his new PARCC policy -- on the very same day?

As I've documented here: when it comes to education (and many other topics), editorial writers often rely on the professional "reformers" in their Rolodexes to feed them ideas. If there is a structural advantage these "reformers" have over folks like me, it's that they get paid to make the time to influence op-ed writers and other policy influencers. They are subsidized, usually by very wealthy interests, to cultivate relationships with the media, which in turn bends the media toward their point of view.

One would hope editorial boards could see this past this state of affairs. Alas...

ADDING MORE: From the NJDOE website:
A GUIDE TO PARENT/TEACHER CONVERSATIONS ABOUT THE PARCC SCORE REPORTS 
ABOUT INDIVIDUAL STUDENT SCORES
a) What if my child is doing well in the classroom and on his or her report card, but it is not reflected in the test score?
  • PARCC is only one of several measures that illustrate a child’s progress in math and ELA. Report card grades can include multiple sources of information like participation, work habits, group projects, homework, etc., that are not reflected in the PARCC score, so there may be a discrepancy.
Report cards can also reflect outcomes on tests made by teachers, districts, or other vendors, administered multiple times. The PARCC, like any test, is subject to noise and bias. It is quite possible a report card grade is the better measure of an individual student's learning than a PARCC score.

If there is a disconnect between the PARCC and a report card, OK, parents and teachers and administrators should look into that. But I take the above statement from NJDOE as an acknowledgment that the PARCC, or any other test, is a sample of learning at a particular time, and it's outcomes are subject to error and bias like any other assessment.

Again: by all means, let's have accountability testing. But PARCC fetishism in the service of teachers union bashing is totally unwarranted. Stop the madness.


SCATTERPLOT FUN! Here are some other correlations between NJASK and PARCC scores at the school level. You'll see the same pattern in all grades and both exams (ELA and math) with the exception of Grade 8 math. Why? Because the PARCC introduced the Algebra 1 exam; Grade 8 students who take algebra take that exam, while those who don't take algebra take the Grade 8 Math exam.

The Algebra 1 results are some of the most interesting ones available, for a whole variety of reasons. I'll get into that in a bit...


* OK, I need to make this clear: there was an issue with the NJASK having a bit of a ceiling effect. I've always found it kind of funny when people got overly worried about this: like the worst thing for the state was that so many kids were finding the old test so easy, too many were getting perfect scores!

Whether the PARCC broke through the ceiling with construct-relevant variance is an open question. My guess is a lot of the "higher-level" items are really measuring something aside from mathematical ability. In any case, the NJASK wasn't "lying" just because more kids aced it than the PARCC.

Tuesday, May 1, 2018

What Do We Teach In America's Schools? "Hey, Honey, Sit Down and Shut Up!"

America, it's time to play Spot The Pattern!™

First, Chicago (all emphases mine):
Earlier this month, we posted a story about discipline practices inside Noble Network of Charter Schools, which educates approximately one out of 10 high school students in Chicago. One former teacher quoted in the piece described some of the schools’ policies as “dehumanizing.” 
[...]  
Through the teacher, several students also agreed to communicate by text message. 
One described an issue raised by others at some Noble campuses, regarding girls not having time to use the bathroom when they get their menstrual periods. 
“We have (bathroom) escorts, and they rarely come so we end up walking out (of class) and that gets us in trouble,” she texted. “But who wants to walk around knowing there’s blood on them? It can still stain the seats. They just need to be more understanding.” 
At certain campuses, teachers said administrators offer an accommodation: They allow girls to tie a Noble sweater around their waist, to hide the blood stains. The administrator then sends an email to staff announcing the name of the girl who has permission to wear her sweater tied around her waist, so that she doesn’t receive demerits for violating dress code. 
Last year, two teachers at Noble’s Pritzker College Prep helped female students persuade administrators to change the dress code from khaki bottoms to black dress pants. Although their initiative was based in part on a survey showing that 58 percent of Pritzker students lack in-home laundry facilities, it remains a pilot program available only at the Pritzker campus.
Next, New York City:
A veteran city educator who said officials botched her sexual harassment case is calling out Mayor de Blasio for shaming victims — and omitting dozens of sexual harassment complaints from recently published city statistics.

The educator, who asked to remain anonymous because she fears retaliation, said she was sickened to hear de Blasio say this week that the Education Department substantiated less than 2% of complaints because of a "hyper-complaint dynamic" in the city agency.

"I'm certainly offended that Mayor de Blasio would say that," said the educator, who sued the city over her harassment by a supervisor and won a settlement.

"With a wife and daughter of his own, I was in shock," she added.

She called the city Education Department's investigation into her claims "a long, complicated, ugly process," that ultimately failed to bring her justice.

"No one would go through this if it were not true," she said. "It is a horrific experience. It upends your entire life."

City officials are scrambling to contain a growing sex harassment scandal in the city schools.

A tally of sex harassment complaints published by the city Friday omitted 119 Education Department complaints erased from the record because officials deemed them "non-jurisdictional."  
Figures published by the de Blasio administration on April 20 showed 471 cases of sexual harassment complaints in city schools from 2013 to 2017. But internal records kept by Education Department officials showed 590 complaints during the same period — a figure 25% higher than the number reported by de Blasio. 
Observers said it looks like the Education Department is trying to hide the facts about sex harassment cases. 
"That's exactly what's happening here," said New York City Parents Union President Mona Davids. "They covered things up and they squashed the complaints."
NYC teacher Arthur Goldstein has more on this.

Let's go to Washington:
At a roundtable with the nation’s top educators on Monday afternoon, at least one teacher told Education Secretary Betsy DeVos that her favored policies are having a negative effect on public schools, HuffPost has learned. HuffPost has also obtained video of DeVos expressing disapproval of the teachers strikes currently roiling Arizona.

DeVos met privately with more than 50 teachers who had been named 2018 teachers of the year in their states. As part of the discussion, teachers were asked to describe some of the obstacles they face at their jobs and were given the opportunity to ask the education secretary questions. 
[...] 
DeVos also expressed opposition to teachers going on strike for more education funding, per video of the meeting obtained by HuffPost. DeVos made her comments after Josh Meibos, Arizona’s teacher of the year, asked her about when striking teachers will be listened to. In response, DeVos told Meibos that she “cannot comment specifically to the Arizona situation,” but that she hopes “adults would take their disagreements and solve them not at the expense of kids and their opportunity to go to school and learn.”

“I’m very hopeful there will be a prompt resolution there,” DeVos can be heard saying in the video. “I hope that we can collectively stay focused on doing what’s right for individual students and supporting parents in that decision-making process as well. And there are many parents that want to have a say in how and where their kids pursue their education, too.”

She continued, “I just hope we’re going to be able to take a step back and look at what’s ultimately right for the kids in the long term.”
When reading this, keep in mind that about three-quarters of America's teachers are women. So when DeVos tells teachers they shouldn't protest against receiving low wages, she's very much telling women to stop complaining that their pay is low compared to other professions for college-educated workers -- professions more like to employ men.

It's also worth noting that DeVos is sticking to a set of talking points about the teachers strikes that she paid for.

Back to Washington:
We all know that black girls are disciplined more harshly for the same infractions as their white peers in schools (and life), but a new study shows that part of this disparity is linked to school-uniform policies.
The National Women’s Law Center recently looked at school dress codes in Washington, D.C., and found that black girls are unnecessarily and predominantly penalized under uniform rules.  
In fact, because humans in their unconscious and implicit biases are the ones who enforce rules around dress codes, it goes without saying that sexism, racism and traditional gender roles play a part.
According to the study, black girls were found to often be in violation of dress codes for so-called infractions like being “unladylike,” “inappropriate” or “distracting to the boys around them.”
Of course, no one should expect DeVos's Department of Education to investigate racial bias in school discipline anytime soon: her crew is too busy suppressing investigations. But while the intersection of sexism and racism makes these dress codes especially pernicious for girls of color, girls of all races are regularly made to feel ashamed of their bodies while in school.

Like in Florida:
Lizzy Martinez, 17, a junior at Braden River High School in Bradenton, Fla., had been swimming and tanning all weekend at a water park in Orlando. But when Monday morning came and she had to get dressed for school, Lizzy’s bra felt painfully constricting on her burned skin. 
So she ditched the bra and purposely chose to wear something dark and loose — a long sleeve, oversize, crew neck gray T-shirt — so she wouldn’t draw attention to her chest.
But around 10 a.m., about 15 minutes into her veterinary assistance class, Lizzy was called out of the classroom for a meeting with two school officials, Dean Violeta Velazquez and Principal Sharon Scarbrough. They asked her why she wasn’t wearing a bra
She said she told her school administrators about the sunburn. They insisted that she was violating the school dress code. (The 2017-2018 Code of Student Conduct does not say bras must be worn by female students.) They told her to put on an undershirt because boys were “looking and laughing” at her, a detail she later challenged. “No one said a thing to me until I got to the dean’s office,” Lizzy said. 
She was crying and wanted to go home, so Lizzy’s mother, Kari Knop, a registered nurse, was called at work. “I said, ‘Lizzy, I’m working,’” Ms. Knop said in a phone interview. “I told her, ‘Can you just put the undershirt on and call it a day?’” 
Lizzy was embarrassed and angry but she relented. When she returned wearing the undershirt, the school principal had left. The dean, according to Lizzy, instructed her to “stand up and move around for her.” 
“I looked at her and said, ‘What do you mean?’” Lizzy said. “I was a little creeped out by that.” The school has a strict disciplinary policy and she didn’t want to appear defiant. (School officials refused to comment, except in a statement.) 
The dean told her that her nipples were still showing through her T-shirt and she should use bandages to cover them up. “She told me, ‘I’m thinking of ways I could fix this for you.’ She said, ‘I was a heavier girl and I have all the tricks up my sleeve,’” Lizzy said.  
Lizzy was given four adhesive bandages from the school clinic. “They had me ‘X’ out my nipples,” she said.
Even if you have a conservative point of view on what is and isn't appropriate for students to wear at school... you can't tell me this story isn't creepy. But this is how we tell girls to think about their bodies now.

Another story from Michigan*:
With prom season in full swing, many teens attending schools with harsh dress codes are taking to social media to call them out. This week, one school in Michigan has decided to take their policies a step further with items that they’re calling “modesty ponchos,” and the students are not having it. 
Prom night at Divine Child High School in Dearborn, Michigan is set for May 12, and the school has already announced that they would be handing a colorful poncho-like piece of fabric to all of the girls who show up wearing something that the school deems too revealing, reports Fox 2 Detroit. A student told the news source that “teachers will determine whether what they’re wearing is compliant or not when they walk in the door.” She added, “I do believe the school has gone too far with this. As we walk into prom, we are to shake hands with all the teachers and if you walk through and a teacher deems your dress is inappropriate you will be given a poncho at the door.”
To be clear: I am not against schools setting some reasonable restrictions on student dress. No student, for example, should be allow to wear clothing that has wording intended to denigrate others. Reasonable people can disagree about where the lines are. But there is, to my eye, a distinct odor of slut-shaming in many of these policies -- which goes a long way toward explaining the racist skew in how they're implemented.

So, what have we got going on in America's schools these days?

  • Girls can't use the bathroom when they have their periods.
  • Women teachers who file charges of sexual harassment are told they are "hyper-complainers."
  • Teachers -- again, most of whom are women -- are told their protests against making a pittance are "at the expense of kids."
  • Girls are told by school officials they need to cover up, because their bodies are too distracting.
America's schools are swimming in sexism. Both teachers and students suffer from the consequences of systemic misogyny.

Add to all this the hidden (and not so hidden) curricula in racism, homophobia, heteronormativity, Islamaphobia, and so on...

You know, I don't know why a social conservative like Betsy DeVos is against public schools. They seem to be transmitting exactly the values she and her ilk hold so dear.

“I think that putting a wife to work is a very dangerous thing.”- Donald Trump.


* OK, yes, Divine Child is a Catholic school. But it's not like the phenomenon of slut-shaming at the prom is restricted to private schools:

Prom is supposed to be the most magical night of your high school life — you get your hair and makeup done; you wear the gorgeous gown that makes your mom cry, "You're all grown up"; and you generally look flawless as you kiss good-bye to your awkward years. 
For these teens, prom was ruined when their outfits were banned. Check out their "inappropriate" and "immodest" choices to see for yourself that these girls look beautiful, no matter what their school says.
I don't have daughters, but if I did, I wouldn't have a problem with them wearing any of these outfits. Your mileage may vary, but that's the point: why is the school making these decisions? As one of the girls -- who is wearing what I would say is a very modest dress -- says:
"Maybe instead of teaching girls that they should cover themselves up, we should be teaching boys that we're not sex objects that they can look at."
Amen.

By the way: #6 is infuriating. What is wrong with people?