This caught my attention:
New Jersey school districts may soon be evaluated differently, with a greater emphasis on student growth as compared to student achievement.
The Department of Education is proposing changes to the New Jersey Quality Single Accountability Continuum, known as NJQSAC, which is used to evaluate the effectiveness of school districts every three years. The accountability system looks at five areas: instruction and programs, fiscal management, governance, personnel and operations.
Several school superintendents pitched their concerns with the current evaluation system at a State Board of Education meeting on Wednesday. Speakers said they support putting a greater emphasis on growth but noted this is just a start, as other issues remain that make it difficult for low-income and high-diversity school districts to earn passing scores. [emphasis mine]
I'll be the first to say that QSAC does need an overhaul -- or, at the very least, a serious review, particularly the "instruction and programs" component. There are always going to be problems when you are trying to assess the behaviors of school districts by assessing the behavior of students, which is what QSAC does. At the very least, we should acknowledge those problems.
For example: Yes, student performance is certainly going to be affected by the performance of school districts. But district operation is certainly not the only thing that causes student test scores to rise or fall. If a school district has proportionally more students in poverty, its test scores will be lower; that doesn't mean it's doing a "bad" job, it's just enrolling more students who are at a disadvantage.
School leaders in New Jersey get this:
Springfield School District Superintendent Rachel Goldberg said NJQSAC is inequitable and unreliable. She compiled NJQSAC data from the last 18 months and found instruction and program scores are directly correlated to the economics of an area.
“What this means is we are not measuring school quality, we are measuring socioeconomics,” Goldberg said.
This is exactly right; let's look at some examples.
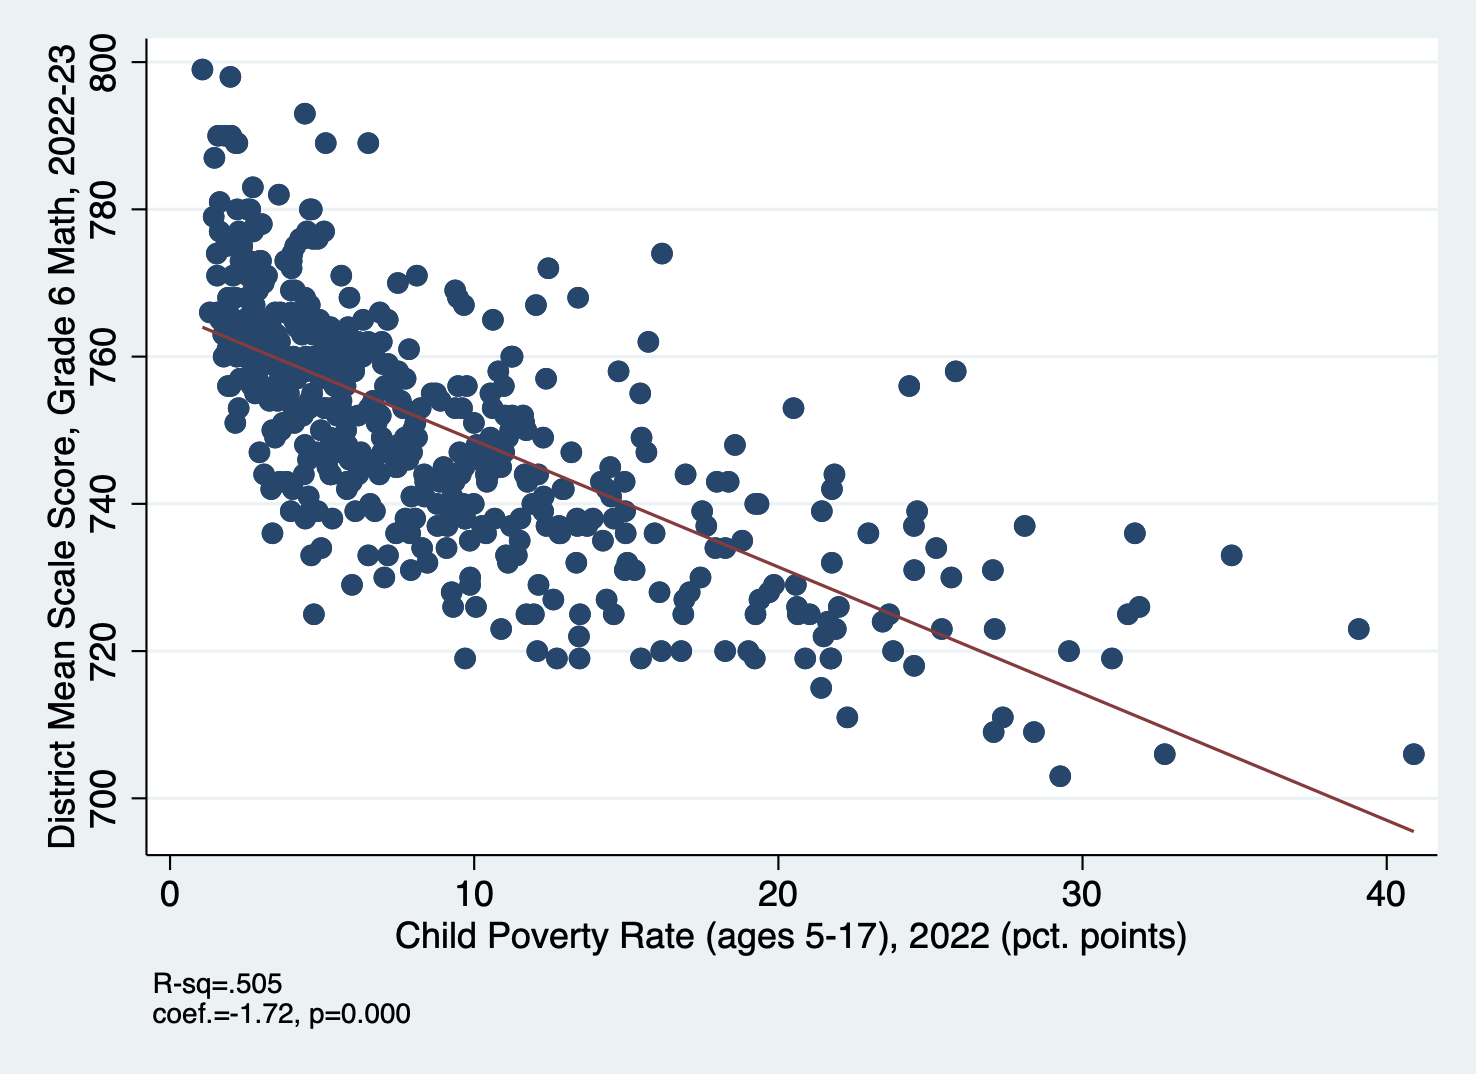
Here are the New Jersey school districts for which we have data* on their child poverty rate and their mean (average) scale score in the statewide 6th Grade math exam. Clearly, as poverty rates go up, test scores go down (it's the same in other subjects and grades). The "R-squared" tells us that half of the variation in test scores can be statistically explained by poverty rates. Yes, districts with the same poverty rate can vary in their test scores: some score higher than predicted, and some lower. But the overall trend is clear: as poverty rises, test scores fall.

Here are Grade 6 math scores against median household income. As we would expect, scores rise when income rises. When Dr. Goldberg says, "...we are not measuring school quality, we are measuring socioeconomics," this is what she means. This isn't fair to school districts, and it needs to be fixed.
The problem is this: what if the proposed solution is also not measuring school quality, but students' socioeconomic conditions?
Under the proposed changes, progress in math and English Language Arts would be worth more points than achievement in math and English Language Arts in K-8 and K-12 schools. Progress would be measured using student growth percentiles, which measure the relative year-to-year performance changes of students compared to other students with similar prior test scores.
The assumption under which this proposal works is that "progress" is not biased the way that "achievement" is; districts with less-affluent populations would have an equal chance with districts that have more-affluent populations to show "progress."
But when you look at the data*, it's clear that this isn't the case.

Here are growth measures -- known in New Jersey as Student Growth Percentiles, or SGPs -- plotted against poverty rates. Compared to the graph above that plotted test scores against poverty, it's evident that the explanatory power of poverty on growth isn't as great as poverty on achievement -- but there is a correlation, and it's significant. As poverty rises, SGPs fall -- and while the correlation isn't as strong as above, it's still statistically significant (that "p=0.000" note is telling us this). On average, if the child poverty rate in a school district goes up by 10 percentage points (say, from 10% to 20%), SGPs drop by a little more than 5 points.

We can see this also when plotting income and SGPs. Again, the correlation isn't as strong as with income and test scores, but the correlation is there, and it's significant (p=0.000). On average, if district median income goes up $50,000, SGPs rise 3.5 points.
Now, at first glance, that may not sound like a lot. But you've got to remember that SGPs are a relative measure. SGPs rank and order districts (or schools, or students) compared to each other, and not to some objective standard of growth. It is conceivable that all school districts in New Jersey showed some level of growth in test scores, but some districts grew more than others. So some districts are going to get dinged under QSAC, even if their students made progress. Somebody's got to be at the bottom of the distribution.
When SGPs were first introduced into the state, then-Commissioner of Education Chris Cerf assured everyone that SGPs :"...fully take[s] into account socio-economic status..." It wasn't true then, and it's not true now, which is why I and others strongly objected to including them in teacher evaluations.
Why are SGPs still biased? It's complicated (I try to break it down here). The short answer is that test scores are measured with error: sometimes scores from the same student in the same subject vary because of a host of factors that have nothing to do with their abilities (or their teacher's). That error leads to the SGP model understating the predictive power of prior tests on later ones. Again, it's a complex problem -- which just serves to highlight how unfair it is to hold school districts (or teachers, or students) accountable using a metric only a scant few people who are highly conversant in statistical methods and psychometrics understand.
Am I saying we can't use student test scores at all to help evaluate and oversee school districts? Not necessarily. The inventor of SGPs himself has noted that they may not show a causal relationship between district quality and student outcomes, but as a descriptive measure, they could help to identify districts that may be in need of remediation. With appropriate training, the NJDOE might consider using SGPs as a way to better allocate their limited time, using them as a sort of early warning system to point to districts that may need to improve their instruction and programs.
What New Jersey absolutely should not do is come up with some hard-and-fast formula that weights SGPs by some amount, then tag districts that don't come up to a particular threshold. Remember, the core rule for using test outcomes in any sort of accountability system is that there must be a convincing validity argument made for using them in this way, and that higher stakes demand stronger arguments. That has not happened with using any test outcomes as a part of QSAC, let alone SGPs.
A final thought: As we emerge from the pandemic and get back to "normal," we're going to be revisiting a lot of issues in education policy, such as the appropriate use of high-stakes testing. I believe this actually affords us an opportunity to clear up some of the misconceptions and misunderstandings that dogged us for years during the "reform" era. Let's not miss that opportunity.
More to come...
* Poverty and income measures are from the School Finance Indicators Database, which gets the data from the American Community Survey of the US Census Bureau. SGPs and test scores are from the School Performance Reports published by the NJDOE.