This morning at 10 AM, I will present this testimony about One Newark. More to come.
Mark Weber
Mark Weber
Testimony before the
Joint Committee on the Public Schools
New Jersey
Legislature
Tuesday, March 10,
2015
INTRODUCTION
Good morning. My name is Mark Weber; I am a New Jersey
public school teacher, a public school parent, a member of the New Jersey
Education Association, and a doctoral student in Education Theory,
Organization, and Policy at Rutgers University’s Graduate School of Education.
Last year, I was honored to testify before this committee
regarding research I and others had conducted on One Newark, the school
reorganization plan for the Newark Public Schools. Dr. Bruce Baker, my advisor
at Rutgers and one of the nation’s foremost experts on school finance and policy,
joined me in writing three briefs in 2014 questioning the premises of One
Newark. Dr. Joseph Oluwole, a professor of education law at Montclair State
University, provided a legal analysis of the plan in our second brief.
I would like to state for the record that neither myself,
Dr. Baker, nor Dr. Oluwole received any compensation for our efforts, and our
conclusions are solely our own and do not reflect the views of our employers or
any other organization.
Our research a year ago led us to conclude that there was
little reason to believe One Newark would lead to better educational outcomes
for students. There was little empirical evidence to support the contention
that closing or reconstituting schools under One Newark’s “Renew School” plan
would improve student performance. There was little reason to believe
converting district schools into charter schools would help students enrolled
in the Newark Public Schools (NPS). And we were concerned that the plan would
have a racially disparate impact on both staff and students.
In the year since my testimony, we have seen a great public
outcry against One Newark. We’ve also heard repeated claims made by State
Superintendent Cami Anderson and her staff that Newark’s schools have improved
under her leadership, and that One Newark will improve that city’s system of
schools.
To be clear: it is far too early to make any claims, pro or
con, about the effect of One Newark on academic outcomes; the plan was only implemented
this past fall. Nevertheless, after an additional year of research and
analysis, it remains my conclusion that there is no evidence One Newark will
improve student outcomes.
Further, after having studied the effects of “renewal” on
the eight schools selected by State Superintendent Anderson for interventions
in 2012, it is my conclusion that the evidence suggests the reforms she and her
staff have implemented have not only failed to improve student achievement in
Newark; they have had a racially disparate impact on the NPS certificated
teaching and support staff.
Before I begin, I’d like to make a point that will be
reiterated throughout my testimony: my analysis and the analyses of others
actually raise more questions than they answer. But it shouldn’t fall to
independent researchers such as me or the scholars I work with to provide this
committee or other stakeholders with actionable information about Newark’s
schools.
Certainly, we as scholars stand ready to provide assistance
and technical advice; but the organization that should be testing the claims of
NPS and State Superintendent Anderson is the New Jersey Department Of Education.
The students and families of Newark deserve nothing less than a robust set of
checks and balances to ensure that their schools are being properly managed.

One Newark can be thought of as containing four components:
the expansion of charter schools; a “renewal” program for schools deemed to be
underperforming; a system of consumer “choice,” where families select schools
from a menu of public and charter options; and continuing state control of the
district.
This last component is clearly a necessary precondition for
the first three. Given the community outcry against State Superintendent
Anderson and One Newark, it’s safe to say that none of the other three
components would have been implemented were it not for continuing state
control.
The critical questions I ask about these components are
simple: do they work, are there unintended consequences from their
implementation, and is One Newark being properly monitored and evaluated? Let
me start by addressing the expansion of charter schools in Newark.
CHARTER SCHOOLS

This past fall, I authored a report on New Jersey charter
school demographics with Dr. Julia Sass Rubin of the Bloustein School of Planning
and Public Policy at Rutgers University. This report was commissioned by the
Daniel Tanner Foundation.[1]
Using publicly available data, we found that Newark’s charter schools, like
charter schools throughout the state, serve a different population of students
on average than their host districts.

This slide, from my first report with Dr. Rubin, shows that
Newark’s charter sector serves fewer students eligible for free lunch, a proxy
measure for economic disadvantage. Charters serve very few Limited English
Proficient (LEP) students, fewer boys, and a substantially different racial
profile of students than NPS’s schools.
This disparity in student populations has been acknowledged
by State Superintendent Anderson herself, who said last fall: “I’m not saying
they [the charter schools] are out there intentionally skimming, but all of
these things are leading to a higher concentration of the neediest kids in
fewer [district] schools.”[2]
The data does, indeed, back up the State Superintendent’s claim.

Another important difference between charter and district
schools is the proportion of special education students they serve. Overall, no
charter school serves as large a proportion of special needs students as NPS.
Yes, there is variation between the district schools, but this is to be
expected: some NPS schools specialize in serving students with particular
learning disabilities.

In 2011, the NJDOE commissioned a report that outlined the
costs of serving students with a variety of learning disabilities.[3]
The costs of Specific Learning Disabilities (SLDs) and Speech/Language
Impairments (SPL) were found to be low compared to other impairments. As this graph
shows, Newark’s charter schools serve proportionately more students with
low-cost disabilities compared to NPS.[4]
This is both a cost and logistical burden on NPS that the
charter schools do not share. As we shall see, this difference likely has a
profound effect on school finances in Newark.

The following graphs come from analyses that will be
presented in an upcoming report on New Jersey charter school finances, authored
by myself and Dr. Sass Rubin, to be released later this year. According to
NJDOE data, Newark charter schools do, on average, spend less per pupil than
NPS schools. However, charters spend less on student support services, and far
more on administration. We must ask, at a time when New Jersey is under great
budgetary stress, whether it is prudent to replicate independently managed
schools within the same city, particularly when their administrative costs are
so high.

Data from NJDOE’s “Taxpayers Guide to Education Spending”
(TGES) shows that the budgetary costs per pupil – the Department’s preferred
metric for comparing education spending across districts[5]
– are greater at NPS than the Newark charter sector as a whole. This trend is
seen in cities across the state.

However, we must once again remember that district schools
serve a different population of students than charter schools. These special
education figures comes from the TGES; again, in Newark there is a substantial
gap between the percentage of special needs students in the charters and in NPS
schools. Undoubtedly, this affects per pupil spending costs.

This slide shows the differences in spending on student
support services between charter schools and district schools. Support services
include attendance, social work, health, guidance, educational media/school
library, child study team, and so on. These are precisely the sorts of services
we would expect to be provided more extensively by schools that serve larger
populations of at-risk, special needs, and LEP students.
As in every other city, NPS far outspends its city’s charter
sector on these services. NPS spends $3,963 more per pupil on support services
than the charter sector as a whole. Clearly, the responsibility NPS has to
educate more students with more costly disabilities relative to the charter
schools is affecting school finances in Newark.
This begs a question: where else do Newark’s charter schools
spend their money?

This slide gives us a clue. Newark’s charter sector spends,
on average, $1,795 more per pupil on administrative costs. Again, it is
possible that Newark’s charters simply can’t leverage the economies of scale
NPS schools can. But there is another possible explanation:

Newark’s charters spend, on average, $1,098 more per pupil
on administrative salaries than NPS. Again, this is typical of the trend across
the state.

This raises the question of efficiency: are charters
actually more efficient than district schools? In other words: given
differences in student characteristics and available resources, which schools
achieve the best test-based outcomes? Which schools really “do more with less”?

Dr. Bruce Baker has created a model, using a standard
statistical technique called a linear regression, that allows for the
comparison of efficiencies between Newark charter schools and NPS schools. Dr.
Baker explains this model in a series of briefs; you can find links in my
written testimony.[6]
Basically, this method of comparison uses several inputs –
special education percentages, free-lunch eligibility, staffing costs per
pupil, and school size – to “hold all things constant.” In other words, Dr.
Baker’s model attempts balance the scales for schools that serve more special
need students, or more at-risk students, or spend less on staff, so that these
schools aren’t disadvantaged in a comparison of test-based outputs. This, then,
is a statistical model that makes comparisons fair.

With Dr. Baker’s permission, I have annotated his work here.
The red bars represent Newark charter schools; the blue bars are NPS schools.
I’ve further modified the graph so the “Renew Schools,” which I will discuss
shortly, are in light blue.
The schools with bars that point upward are schools that are
“more efficient”: given their student populations, their spending on staff, and
their size, they produce better growth on student test scores than we would
predict.
The schools with bars that point downward are schools that
are “less efficient”: given their student populations, their spending on staff,
and their size, they produce lower growth on student test scores than we would
predict.
How does the charter sector fare overall? Certainly, some
charters do well. But Robert Treat Academy, often touted in news reports as one
of the highest performing charter schools in the city, is a relatively poor
performer in this efficiency model. TEAM Academy, affiliated with the national
charter management organization KIPP and often cited as another high-performing
school, is quite average in this comparison.
Let me be clear: neither Dr. Baker nor I would ever claim
that this analysis should be used as the final word on which schools perform
well and which do not. As we shall see next, there are many other factors, not
included in this model, which can affect test score growth.
What is evident here, however, is that the simplistic claim
that charter schools “do more with less” is a gross mischaracterization of a
highly complex interaction between student characteristics, resources, and
test-based results. Simple claims that allowing charter schools to expand will
lead to more great schools in Newark are just not warranted.

I mentioned that Dr. Baker’s model does not account for many
factors that may explain the relative successes of certain Newark charter
schools. One of those factors is attrition. There has been quite a bit written
about this issue, so I’d like to make sure we get our terms straight before we
look at this factor.
“Cohort attrition” is the year-over-year loss of students at
a school within the same grade level. If, for example, a school enrolls 100
fifth grade students in 2014, and then 90 sixth grade students in 2015, that is
a cohort attrition rate of 10 percent.
The role of student attrition in explaining charter school
outcomes has been a source of national debate.[7]
Admittedly, it is impossible to get precise estimations of the effects of
cohort attrition without student level data.

Even though we have incomplete data, however, we can look at
it to discern whether there is enough evidence to warrant an investigation.
Here is the cohort attrition for the Class of 2014 at NPS schools, TEAM Academy
Charter School, and North Star Academy Charter School. The graph shows how the
number of students declines each year for the grade level that was on track to
graduate in the spring of 2014, starting in Grade 5. Each year shows the number
of enrolled students in that class as a percentage of students enrolled in
Grade 5 back in 2006-07.
NPS’s Class of 2014 was 76 percent of the size it was back
when it was enrolled in Grade 5 in 2006-07. In contrast, TEAM’s Class of 2014
was only 59 percent of its size by it senior year; North Star’s was only 56
percent of its Grade 5 size.

To be fair, this class was somewhat unusual for TEAM. While
its cohort attrition for the Class of 2013 was still greater than NPS’s, the
gap between the two systems was not as great as with the Class of 2014. North
Star, however, only retained 43 percent of its original class size.

The question we should ask is whether this attrition affects
test score outcomes: are low performers leaving charter schools, helping to
boost their average test scores? Again, we need student-level data to answer
this question; however, we can look at publicly available data for some
interesting clues.

This graph superimposes cohort attrition for the Class of
2018 – the last class for which we have NJASK Grade 8 data – with average scale
scores for each year’s NJASK English Language Arts (ELA) test. Note that North
Star starts with higher scale scores for this class in Grade 5 than NPS;
however, the gap increases as the size of North Star’s cohort shrinks. The NPS
Class of 2018 cohort, in contrast, barely changes during this time.
The critical question then is this: were students who left
North Star a drag on the school’s average test scores? Does the school retain
high performers while lower performers leave? Again, there is no way to know
without individual student data; however, there is, in my opinion, more than
enough evidence for the NJDOE to begin a serious investigation into the role of
cohort attrition on test score outcomes.
RENEW SCHOOLS

I’d like to turn my attention now to the next component of
the One Newark plan: “Renew” schools. In March of 2012, State Superintendent
Anderson announced a plan that would, among other reforms, require all staff
members at eight NPS schools to reapply for their jobs.[8]
The wholesale turnover of a teaching staff is known as
“reconstitution.” While not all teachers were necessarily replaced in the plan,
our analysis indicates there was a significant change in the staff of the eight
Renew schools.
My review of the research shows that there is no evidence
that reconstitution is a consistently successful strategy for improving
schools. In fact, reconstitution can often be risky, leading to students
enrolling in schools that underperform compared to where they were previously
enrolled.

In December of 2014, the Alliance for Newark Public Schools
published a report[9] by Dr. Leonard
Pugliese, regional vice-president of the American Federation of School
Administrators and a faculty member at Montclair State University. This table
is from that report.
Dr. Pugliese found that, in most cases, the passing rates on
NJASK tests for the Renew schools actually decreased
over the two years of their renewal.

Extending this work, I examined the Renew schools through
several other lenses. Revisiting Dr. Baker’s efficiency model, I changed the
parameters to only look at school outputs over the last two school years.
Obviously, it is too early to make definitive conclusions about the efficacy of
the Renew strategy; however, this early look shows that there is no consistent
pattern of Renew schools demonstrating any more efficiency, as a group, than
the rest of Newark’s schools.

Further: in their first year of “renewal.” the eight schools
showed, on average, a sharp drop in their median Student Growth Percentile (mSGP)
scores compared to the rest of NPS’s schools. This slide shows the drop in ELA
mSGP scores for the Renew schools. It is worth noting that SGPs compare
students – and, consequently, schools – to other students with similar test
score histories. In other words, the bounce back up in mSGP in year two of
renewal does not likely indicate a return to where the schools were before renewal, because the schools are
now being compared to lower-performing schools. It is, likely, easier for the
Renew schools to show growth, because their growth was low in year one of
renewal.

Here we see the same pattern for Math mSGP scores. Again,
the bounce in year 2 likely indicates that it is easier for Renew schools to
now show growth as their new comparison schools are lower performing.

Test-based outcomes were not the only changes at the Renew
schools. My analysis of NJDOE staffing data shows several remarkable trends
after renewal. The average experience of the staff at these schools, following
reconstitution, declined significantly, and the percentage of staff with less
than three years of experience increased.

The average of teacher experience before renewal was 14.8
years; after renewal, average experience dropped to 11.1 years, and stayed
roughly the same in the next year.

Before renewal, 11% of teachers had less than three years of
experience; after renewal, 26% of teachers were similarly inexperienced. The
research consensus is clear: teachers gain most in effectiveness during their
first few years of teaching.[10]
The large increase in novice teachers likely made the overall teaching corps
for the Renew schools less effective.

Experience, however, was not the only change in staff
characteristics following renewal.
In the program’s first year, the percentage of black teachers at these
schools dropped substantially. Keep in mind that most of the Renew schools
serve a majority black student population.
A recent article in the peer-reviewed journal Urban Education reviews the literature
and concludes that black students benefit from having teachers of their own
race.[11]
While there is no indication that the change in the racial composition of the
Renew schools’ staffs was deliberate, there may still have been unintended
consequences.

This graph shows the student populations for the eight Renew
schools; all but one have majority black student populations. In those seven,
at least 75% of the student body is black.
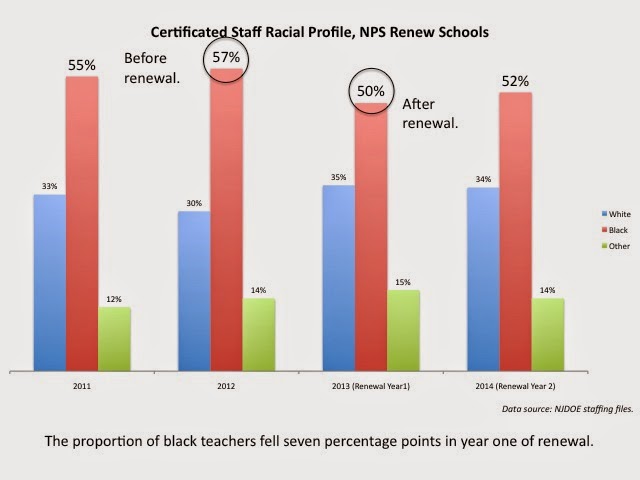
And yet, in the first year of renewal, the proportion of
black teachers declined by seven percentage points.
What did “renewal” ultimately mean for these schools?
Intentionally or not, it meant fewer black teachers with experience – this in
schools with large proportions of black students. It also meant a significant
drop in growth scores, and a decline in proficiency on state tests.
Again: it is too early to come to a definitive conclusion
about the efficacy of the Renew schools program. All early indications,
however, are not promising.
ONE NEWARK and “CHOICE”
I turn now to the third component of One Newark: school
“choice.” The One Newark plan called for students and families to choose their
schools from a menu of charter and district schools, using a single
application. I won’t recount the many problems with this application system –
nor the subsequent staffing, transportation, and logistical problems – as those
have been well reported in the press.
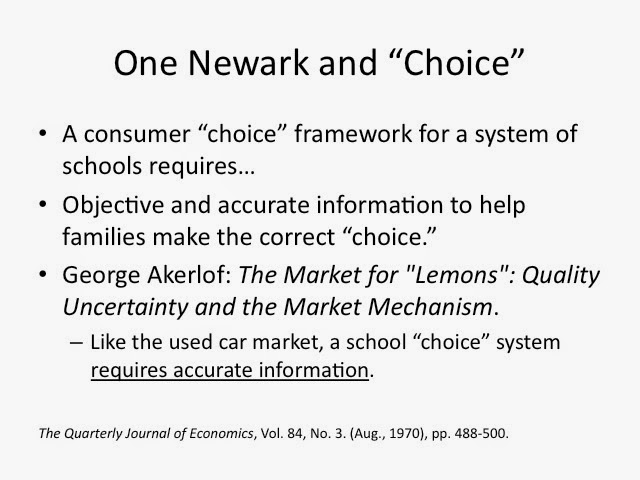
I will, however, refer to a classic economics paper from George
Akerlof titled “The Market for ‘Lemons’: Quality Uncertainty and the Market
Mechanism.” Akerlof used the used car market to explain that a consumer model
only works when there is adequate and impartial information available to
consumers. Without this information, consumers are not only likely to fall
victim to unscrupulous providers; providers of quality goods are less likely to
enter the market.

A market system of choice for schools, then, requires that
families have high-quality information about the schools they are choosing. NPS
attempted to provide that information on the One Newark application, labeling
schools at three different tiers. “Falling Behind” schools are those that
allegedly lag in student outcomes. “On the Move” schools are supposedly
improving in their performance; “Great” schools supposedly serve their student
well.
It is reasonable to think that Newark’s families leaned
heavily on this application when making their school choices. But what was NPS
actually measuring? Were they taking into account the differences in student
populations when judging test score outcomes?

To judge this, I conducted an analysis using a linear
regression model, and published the results in a brief this past spring.[12]
By using a statistics tool to “hold all things equal,” I’m able to show which
schools performed above or below where we would predict them to be, given their
student populations.
Logically, we would expect the “Falling Behind” schools to
perform below prediction, and the “Great” schools to perform above. In fact,
however, the ratings are all over the map: there are “great” schools that
under-perform, and “Falling Behind” schools that over-perform.
This question, then, is how NPS was judging whether schools
were “Great,” “On the Move,” or “Falling Behind”?

This graph gives us a clue. “Great” schools have fewer free
lunch eligible students, fewer boys, fewer black students, and fewer students
with special needs. The One Newark application, arguably, wasn’t evaluating the
effectiveness of a school; it was, instead, judging the characteristics of its
student population.
I would argue this is not the sort of information that a
family needs when making a school choice. No school should be penalized simply
because it serves a different student population.
CONCLUSION

Today, I will admit that I have raised more questions than I
could answer. The truth is that the body that should be bringing you the
information you need is the New Jersey Department of Education. The appropriate
role of the Department is to provide the data and analysis that you, the policy
makers of this state, need to inform your decisions.
To that end, the Department must be an impartial overseer of
Newark’s, and every district’s, schools. There needs to be a system of checks
and balances put in place to ensure that NPS and State Superintendent Anderson
are pursuing programs that have a good chance of succeeding.
I know I speak for many education researchers in New Jersey
in stating that we are ready and willing to assist all of the policy makers
responsible for Newark’s schools in formulating programs that can be successful.

One resource for you, your staffs, the NJDOE, and NPS to use
is the New Jersey Education Policy Forum, a collaborative effort of education
policy scholars throughout the state.[13]
Dr. Baker established this resource because he believes, as do I, that scholars
and researchers should make our work available to policy makers and other
stakeholders.
We will continue to monitor Newark’s progress as best we
can, and we stand ready to assist you and all other policy makers in serving
the children of Newark.
Thank you for your time.
[1] Weber, M.,
Sass Rubin, J. (2014). New Jersey Charter
Schools: A Data Driven View, Part
I — Enrollments and Student Demographics. http://www.saveourschoolsnj.org/nj-charter-school-data/
[4] For a
complete discussion of this methodology and the issues with suppressed data,
see Appendix B here: http://www.saveourschoolsnj.org/save/corefiles/wp-content/uploads/2014/10/NJ-Charter-School-Report_10.29.2014.pdf
[6] Research
Note: On Student Growth & the Productivity of New Jersey Charter Schools https://njedpolicy.files.wordpress.com/2015/01/bbaker-njcharters-20151.pdf
Research Note: On Student Growth & the
Productivity of New Jersey Charter Schools https://njedpolicy.files.wordpress.com/2014/10/research-note-on-productive-efficiency.pdf
[9] An Analysis
Of The Effectiveness Of The Conversion Of Eight Newark, New Jersey Public
Elementary Schools Into Renew Schools As Measured By School-Wide Student Pass
Rates On The LAL And Math Sections Of The New Jersey Assessment Of Skills And
Knowledge (NJASK) Test http://afsaadmin.org/wp-content/uploads/2014/12/Renew-Newark-Report.pdf
[11] Cann, C.N.
(2015). “What School Movies and TFA Teach Us About Who Should Teach Urban
Youth: Dominant Narratives as Public Pedagogy.” Urban Education, 50(3) 288–315.
[12] Weber, M.
(2014). “Buyer Beware: One Newark and the Market For Lemons.” NJ Education Policy Forum. https://njedpolicy.wordpress.com/2014/05/23/buyer-beware-one-newark-and-the-market-for-lemons/
5 comments:
Wow and Wow Mark. Great work. Clear, thoughtful and devastating to any champion of One Newark baloney. Well done!
Truly impressive work. The citizens of New Jersey are lucky to have you.
Mark, you are an inspiration! Your school is lucky to have a motivational force in the educational community! Thank you!
I can only second what previous commenters have said. This presentation is so well thought-out, well written, well researched, well organized and clear. Any legislator who truly wants to get the facts about what is going on in the NPS district will be appreciative (the only problem is that we know how most NJ legislators kowtow to Christie and therefore don't want to actually hear the facts).
Thank you Mark for your hard work!
Thanks, everyone. More to come...
Post a Comment